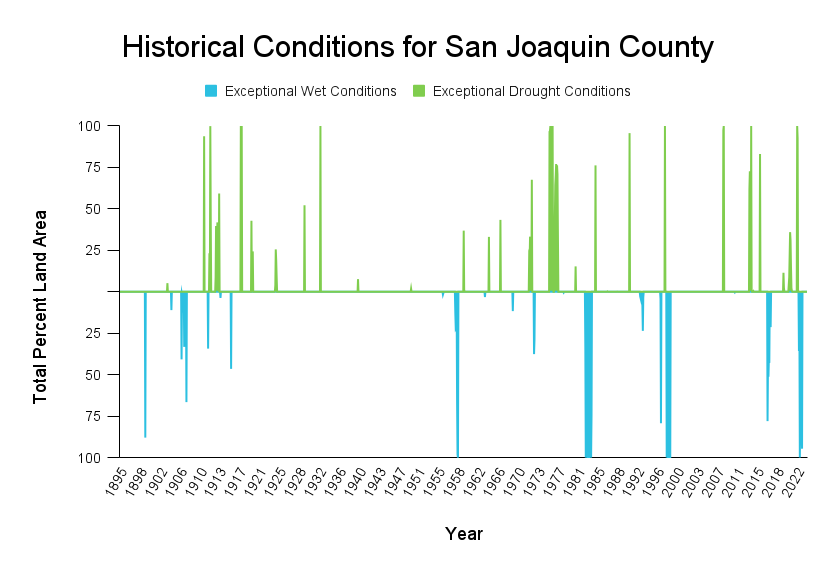
Droughts happen when there’s not enough water to meet demand. The Standardized Precipitation Index (SPI) measures how much precipitation (like rain, hail, or snow) has fallen in an area compared to the average over the 9 months prior. This index helps us understand if conditions are drier or wetter than usual.
For this activity, we’ve pulled data from the driest and wettest months (when SPI values were beyond -2.0 or 2.0) in San Joaquin County between 1895 and 2024. Green on the graph indicates exceptional drought conditions, while blue indicates exceptional wet conditions.

THINK-PAIR-SHARE
Look at the data from San Joaquin County over the last century.
- What does the SPI data tell you about how the water supply has changed in San Joaquin County over time?
- How have the exceptional drought and wet periods shifted over the years? Why do you think these changes happened?
- How might these changes conditions impact farming in the region? What challenges could farmers face?
Stretch Goal: Take a look at the drought data in different states.